
Abstract: This experiment aims to investigate PQQ The application effect of Na2 on the production performance of commercial broiler chickens. 1440 healthy 1-day-old AA broiler chickens with similar body weight were selected and randomly divided into 6 treatments, with 6 replicates per treatment and 40 chickens per replicate (see Table 1). Treatment 1: Control group, fed with a corn soybean meal based basic diet; Processing 2, 3, 4, and 5, the control group was supplemented with PQQ on the same diet basis Na2 0.1,0.2,0.3,0.4 mg/kg; Treatment 6: The control group was supplemented with PQQ on the basis of the same diet Na2 (chemical synthesis) 0.2mg/kg. The experiment is divided into two stages (0-21d, 22-42d). Experimental chicken cage feeding, feeding pellet feed, with consistent dietary composition and nutritional levels between treatments. Experimental chickens were selected for 42 days, with 6 chickens randomly selected from each treatment (1 chicken per replicate) for slaughter experiments to determine meat production performance. The measurement results indicate that:
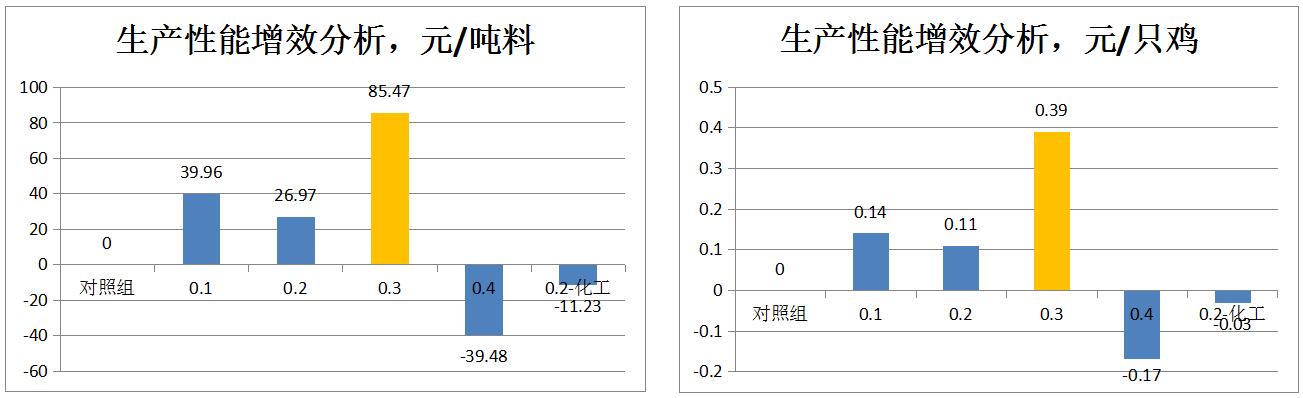
Production performance and economic benefits: Compared with the control group, there was no significant effect on the production performance of broiler chickens (p>0.05), but the daily feed intake from day 1 to 21 showed linear and quadratic changes (p<0.01). Comparing and analyzing numerically, taking the production performance indicators of the control group as 100%, adding PQQ Na2 0.1,0.2,0.3,0.4 mg/kg and chemical PQQ On days 1-21 after Na2 treatment, the daily weight gain was 99.7%, 99.4%, 101.4%, 99.1%, and 99.1%, respectively. The daily feed intake was 99.5%, 99.9%, 100.1%, 99.5%, and 99.2%, and the feed to weight ratio was 99.8%, 100.5%, 98.7%, 100.3%, and 100.1%. On day 21, the body weight was 99.7%, 99.4%, 101.3%, 99.1%, and 99.1%; 22-42d: Daily weight gain was 100.6%, 101.2%, 103.3%, 99.7%, and 100.7%, daily feed intake was 99.6%, 100.2%, 101.8%, 99.4%, and 100.8%, feed to weight ratio was 99.0%, 99.0%, 98.5%, 100.4%, and 100.2%, and body weight at 42 days was 100.3%, 100.6%, 102.7%, 99.1%, and 100.2%; From the perspective of the entire period (1-42d): Add PQQ Na2 0.3 mg/kg increased daily weight gain by 2.7%, daily feed intake by 1.3%, feed to gain ratio by 1.3%, body weight by 2.7% at 42 days, and European index by 1.4%. Other levels of addition were basically the same as the control group. Compared with the control group, adding PQQ Na2 0.1,0.2,0.3mg/kg can increase the net income per ton of feed by 39.96 yuan, 26.97 yuan, and 85.47 yuan, respectively, accounting for a net income increase of 0.14 yuan, 0.11 yuan, and 0.39 yuan per chicken, respectively; Add PQQ Na2 0.4mg/kg and Chemical PQQ Na2 reduces aquaculture profits.
Meat production performance: Compared with the control group, there was no significant effect on the semi clearance rate, full clearance rate, abdominal fat rate, chest muscle rate, and leg muscle rate of broiler chickens, and there was no quadratic or linear trend of change (p>0.05). Comparing and analyzing numerically, with the meat production performance indicators of the control group at 100%, PQQ was added Na2 0.1,0.2,0.3,0.4 mg/kg and chemical PQQ After Na2 treatment, the average weight of slaughtered chickens was 99.18%, 102.39%, 109.22%, 102.36%, and 101.57%, respectively. The semi clearance rates were 99.9%, 100.1%, 100.0%, 100.1%, and 99.9%, the full clearance rates were 99.0%, 99.1%, 100.5%, 101.1%, and 98.8%, the abdominal fat rates were 106.9%, 88.6%, 88.9%, 85.6%, and 100.0%, the chest muscle rates were 101.6%, 103.6%, 101.1%, 99.1%, and 101.4%, and the leg muscle rates were 102.3%, 99.9%, 100.2%, 100.6%, and 101.0%, respectively.
Keywords: commodity broiler, PQQ. Na2, production performance, meat production performance, economic benefits
1. Materials and Methods
1.1 Test Materials
PQQ-Na2: Provided by Shandong Jincheng Biopharmaceutical Co., Ltd;
1.2 Experimental animals and design
1440 healthy 1-day-old AA broiler chickens with similar body weight were selected and randomly divided into 6 treatments, with 6 replicates per treatment and 40 chickens per replicate (see Table 1). Treatment 1: Control group, fed with a corn soybean meal based basic diet; Processing 2, 3, 4, and 5, the control group was supplemented with PQQ on the same diet basis Na2 0.1,0.2,0.3,0.4 mg/kg; Treatment 6: The control group was supplemented with PQQ on the basis of the same diet Na2 (chemical synthesis) 0.2mg/kg. Experimental chicken cage feeding, feeding pellet feed, free feeding and drinking.
1.3 Experimental diet
Temporarily missing
1.4 Test Method
Feeding experiment: The experiment is divided into two stages: broiler chickens (0-21d) and broiler chickens (22-42d). Experimental chicken
Caged, each replicate consists of 2 cages, with 20 animals per cage. Feed pellet feed.
Slaughter experiment: At the end of the feeding experiment (42 days), 6 chickens were randomly selected from each treatment for slaughter.
1.5 Measurement indicators
Production performance: Record feed intake daily and weigh at 21 and 42 days. Calculate the average daily feed intake, average daily weight gain, and feed to gain ratio. Record mortality rate, diarrhea rate, stool characteristics, mental state, etc. Calculate the European index.
Meat production performance: In the 42 day experiment, 6 chickens were selected for each treatment and slaughtered to determine the meat production performance (full bore rate, half bore rate, abdominal fat rate, leg muscle rate, chest muscle rate)
1.6 Data statistics and analysis
The data was analyzed using SAS (SAS Institute, 2000) software, and Duncan's multiple range test was used to compare the mean values, with a significance level of P=0.05. Using linear regression analysis to establish a regression model to determine the variation patterns (linear and quadratic) of various indicators under different additives and levels of additives.
2 Results and Analysis
2.1 Comparative analysis of production performance
Supplementing PQQ in the diet of commercial broiler chickens Na2 and PQQ The impact of Na2 (chemical synthesis) on production performance is shown in Tables 2 and 3. The analysis of variance showed that compared with the control group, there was no significant effect on the production performance of broiler chickens (p>0.05), but the daily feed intake from day 1 to 21 showed linear and quadratic changes (p<0.01). Comparing and analyzing numerically, taking the production performance indicators of the control group as 100%, adding PQQ Na2 0.1,0.2,0.3,0.4 mg/kg and chemical PQQ On days 1-21 after Na2 treatment, the daily weight gain was 99.7%, 99.4%, 101.4%, 99.1%, and 99.1%, respectively. The daily feed intake was 99.5%, 99.9%, 100.1%, 99.5%, and 99.2%, and the feed to weight ratio was 99.8%, 100.5%, 98.7%, 100.3%, and 100.1%. On day 21, the body weight was 99.7%, 99.4%, 101.3%, 99.1%, and 99.1%; 22-42d: Daily weight gain was 100.6%, 101.2%, 103.3%, 99.7%, and 100.7%, daily feed intake was 99.6%, 100.2%, 101.8%, 99.4%, and 100.8%, feed to weight ratio was 99.0%, 99.0%, 98.5%, 100.4%, and 100.2%, and body weight at 42 days was 100.3%, 100.6%, 102.7%, 99.1%, and 100.2%; From the perspective of the entire period (1-42d): Add PQQ Na2 0.3 mg/kg increased daily weight gain by 2.7%, daily feed intake by 1.3%, feed to gain ratio by 1.3%, body weight by 2.7% at 42 days, and European index by 1.4%. Other levels of addition were basically the same as the control group. Explanation: Add PQQ Na2 0.3 mg/kg has the most significant effect on improving production performance.
2.2 Comparative analysis of meat production performance
Supplementing PQQ in the diet of commercial broiler chickens Na2 and PQQ The impact of Na2 (chemical synthesis) on production performance is shown in Tables 4 and 5. The analysis of variance showed that compared with the control group, there was no significant effect on the semi clearance rate, full clearance rate, abdominal fat rate, chest muscle rate, and leg muscle rate of broiler chickens, and there was no quadratic or linear trend of change (p>0.05). Comparing and analyzing numerically, with the meat production performance indicators of the control group at 100%, PQQ was added Na2 0.1,0.2,0.3,0.4 mg/kg and chemical PQQ After Na2 treatment, the average weight of slaughtered chickens was 99.18%, 102.39%, 109.22%, 102.36%, and 101.57%, respectively. The semi clearance rates were 99.9%, 100.1%, 100.0%, 100.1%, and 99.9%, the full clearance rates were 99.0%, 99.1%, 100.5%, 101.1%, and 98.8%, the abdominal fat rates were 106.9%, 88.6%, 88.9%, 85.6%, and 100.0%, the chest muscle rates were 101.6%, 103.6%, 101.1%, 99.1%, and 101.4%, and the leg muscle rates were 102.3%, 99.9%, 100.2%, 100.6%, and 101.0%, respectively. Overall, adding PQQ Na2 0.2,0.3,0.4 mg/kg resulted in higher slaughter chicken body weight, reduced abdominal fat percentage, increased chest and leg muscle percentage, and improved meat production performance of broiler chickens.
2.3 Economic Benefit Analysis
Compared with the control group, adding PQQ Na2 0.1,0.2,0.3,0.4 mg/kg and chemical PQQ After Na2 treatment, the slaughter weight of broiler chickens increased by 0.01kg/individual, 0.02kg/individual, 0.08kg/individual, -0.03kg/individual, and 0.01kg/individual, respectively, and the consumption of feed increased by -0.02kg/individual, 0kg/individual, 0.05kg/individual, -0.03kg/individual, and 0.01kg/individual, respectively. According to PQQ The economic benefits of Na2 on the increase in body weight of broiler chickens after slaughter were evaluated and analyzed (Table 6). After deducting the costs of chicken chicks, feed, and additives, PQQ was added compared to the control group Na2 0.1,0.2,0.3mg/kg can increase the net income per ton of feed by 39.96 yuan, 26.97 yuan, and 85.47 yuan, respectively, accounting for a net income increase of 0.14 yuan, 0.11 yuan, and 0.39 yuan per chicken, respectively; Add PQQ Na2 0.4mg/kg and Chemical PQQ Na2 reduces aquaculture profits.
3. Conclusion
3.1 Compared with the control group, adding PQQ Na2 0.3 mg/kg showed the most significant improvement in production performance, increasing daily weight gain by 2.7%, daily feed intake by 1.3%, feed to weight ratio by 1.3%, body weight by 2.7% after 42 days, and a slight decrease in European index by 1.4%. Other levels of addition were basically the same as the control group.
3.2 Compared with the control group, adding PQQ The weight of slaughtered chickens in the Na2 0.3 mg/kg group significantly increased by 9.22%, with the addition of PQQ Na2 0.2,0.3,0.4mg/kg reduced abdominal fat percentage by 11.4%, 11.1%, 14.4%, PQQ. Na2 0.1mg/kg increased abdominal fat percentage by 6.9%, while other indicators showed no significant changes.
3.3 Compared with the control group, adding PQQ Na2 0.1, 0.2, and 0.3mg/kg can improve the net benefits of broiler farming. Among the three levels of addition, 0.3mg/kg achieved the highest economic benefit, increasing the net income per ton of feed by 85.47 yuan, accounting for a net income increase of 0.39 yuan per chicken.
In summary, compared to other experimental groups, adding PQQ to the diet of commercial broiler chickens Na2 0.3mg/kg can significantly improve production performance and achieve maximum economic benefits in aquaculture.
Table 1 Experimental Design for Broiler Chickens
PQQ.Na2,mg/kg | Repetitions | Chicken count/Repetition | Total number of chickens |
0 | 6 | 40 | 240 |
0.1 | 6 | 40 | 240 |
0.2 | 6 | 40 | 240 |
0.3 | 6 | 40 | 240 |
0.4 | 6 | 40 | 240 |
0.2(Chemical synthesis) | 6 | 40 | 240 |
Amount to | 1440 |
Table 2 Comparative analysis of the impact of PQQ. Na on the production performance of commercial broiler chickens
PQQ.Na2,mg/kg | 1-21d | 22-42d | 1-42d | Weight,g/piece | MSCI Europe | ||||||||
Daily gain g/piece | Daily feed intake g/piece | F/G | Daily gain g/piece | Daily feed intake g/piece | F/G | Daily gain g/piece | Daily feed intake g/piece | F/G | 21d | 42d | |||
0 | 42.73 | 52.19 | 1.222 | 91.61 | 137.61 | 1.503 | 67.17 | 94.90 | 1.413 | 939 | 2862 | 475 | |
0.1 | 42.61 | 51.95 | 1.220 | 92.13 | 137.00 | 1.488 | 67.37 | 94.48 | 1.403 | 936 | 2871 | 481 | |
0.2 | 42.48 | 52.15 | 1.228 | 92.70 | 137.86 | 1.487 | 67.59 | 95.01 | 1.406 | 933 | 2880 | 495 | |
0.3 | 43.32 | 52.25 | 1.206 | 94.67 | 140.10 | 1.481 | 69.00 | 96.18 | 1.394 | 951 | 2939 | 469 | |
0.4 | 42.35 | 51.91 | 1.226 | 90.71 | 136.85 | 1.509 | 66.53 | 94.38 | 1.419 | 930 | 2835 | 476 | |
0.2-Chemical industry | 42.34 | 51.77 | 1.223 | 92.29 | 138.69 | 1.506 | 67.31 | 95.23 | 1.416 | 930 | 2868 | 480 | |
SEM | 0.136 | 0.097 | 0.002 | 0.597 | 0.645 | 0.006 | 0.330 | 0.354 | 0.004 | 2.862 | 13.867 | 3.271 | |
P-value | SDignificance | 0.325 | 0.679 | 0.196 | 0.544 | 0.704 | 0.648 | 0.420 | 0.729 | 0.416 | 0.325 | 0.420 | 0.344 |
Linear | 0.513 | <0.001 | 0.975 | 0.932 | 0.582 | 0.553 | 0.952 | 0.724 | 0.520 | 0.513 | 0.952 | 0.721 | |
Secondary | 0.546 | <0.001 | 0.786 | 0.637 | 0.826 | 0.352 | 0.587 | 0.879 | 0.278 | 0.546 | 0.587 | 0.435 | |
Table 3: Relative Comparison of the Effects of PQQ. Na on the Production Performance of Commercial Broiler Chickens
PQQ.Na2,mg/kg | 1-21d | 22-42d | 1-42d | Weight,g/piece | MSCI Europe | |||||||
Daily gain g/piece | Daily feed intake g/piece | F/G | Daily gain g/piece | Daily feed intake g/piece | F/G | Daily gain g/piece | Daily feed intake g/piece | F/G | 21d | 42d | ||
0 | 100 | 100 | 100 | 100 | 100 | 100 | 100 | 100 | 100 | 100 | 100 | 100 |
0.1 | 99.7 | 99.5 | 99.8 | 100.6 | 99.6 | 99.0 | 100.3 | 99.6 | 99.3 | 99.7 | 100.3 | 101.1 |
0.2 | 99.4 | 99.9 | 100.5 | 101.2 | 100.2 | 99.0 | 100.6 | 100.1 | 99.5 | 99.4 | 100.6 | 104.1 |
0.3 | 101.4 | 100.1 | 98.7 | 103.3 | 101.8 | 98.5 | 102.7 | 101.3 | 98.7 | 101.3 | 102.7 | 98.6 |
0.4 | 99.1 | 99.5 | 100.3 | 99.0 | 99.4 | 100.4 | 99.0 | 99.4 | 100.4 | 99.1 | 99.1 | 100.1 |
0.2-Chemical industry | 99.1 | 99.2 | 100.1 | 100.7 | 100.8 | 100.2 | 100.2 | 100.3 | 100.2 | 99.1 | 100.2 | 101.1 |
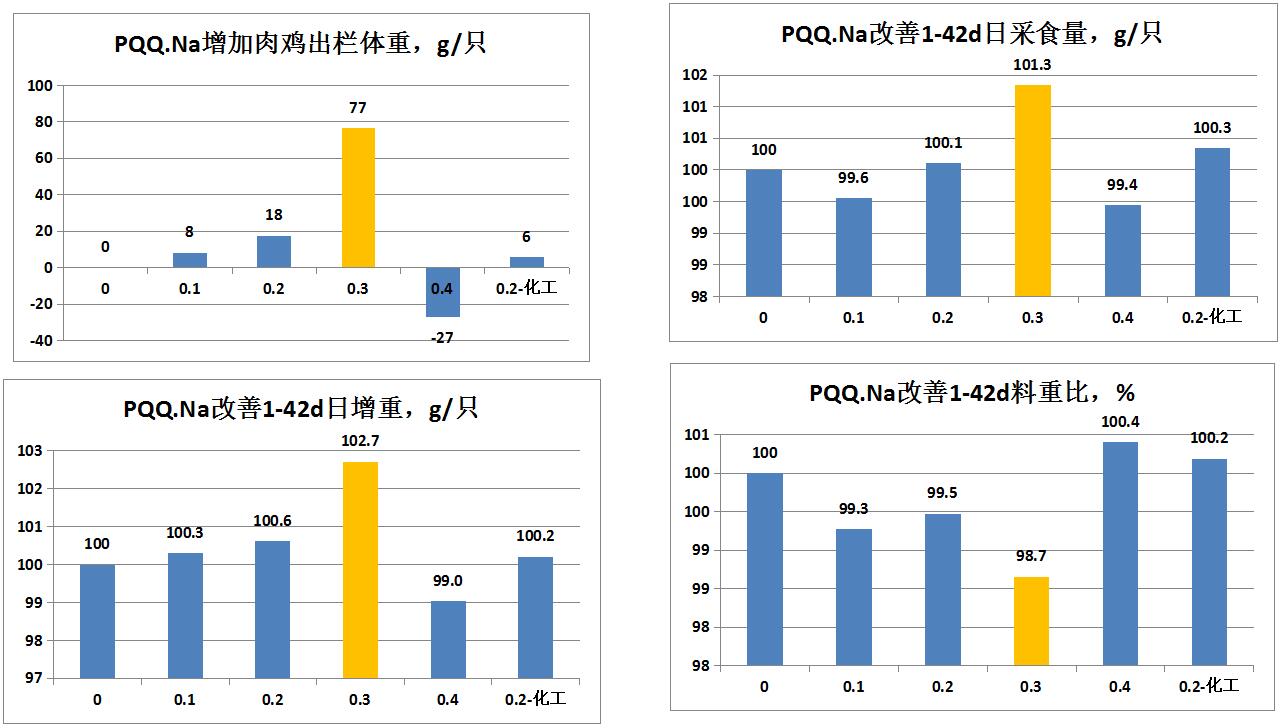
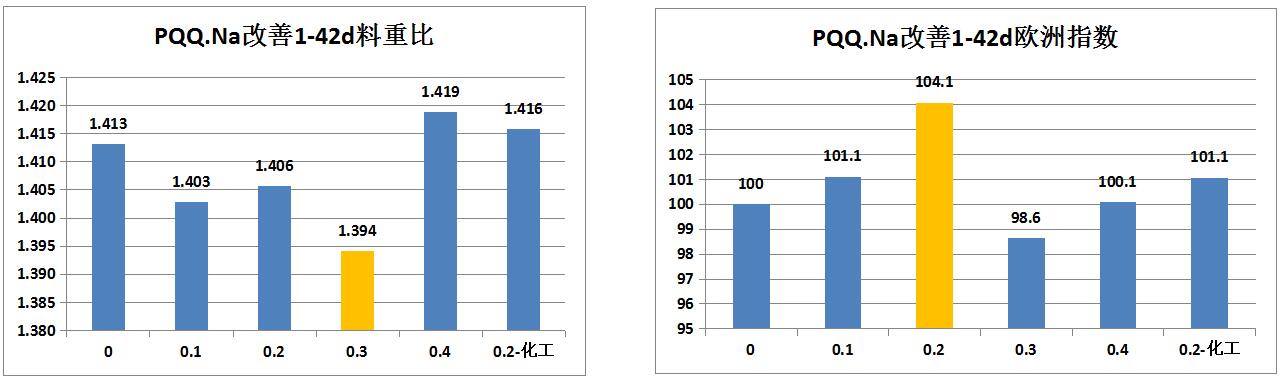
Table 4 Comparative analysis of the effects of PQQ. Na on meat production performance of commercial broiler chickens
PQQ.Na2,mg/kg | Chicken weight,g | Half bore rate,% | Full bore rate,% | Abdominal fat percentage,% | Pectoral muscle rate,% | Leg muscle rate,% | |
0 | 2540.83 | 91.58 | 80.59 | 1.41 | 26.65 | 17.72 | |
0.1 | 2520.00 | 91.52 | 79.75 | 1.51 | 27.07 | 18.12 | |
0.2 | 2601.67 | 91.64 | 79.85 | 1.25 | 27.62 | 17.70 | |
0.3 | 2775.00 | 91.59 | 81.02 | 1.25 | 26.95 | 17.75 | |
0.4 | 2600.83 | 91.66 | 81.50 | 1.21 | 26.43 | 17.83 | |
0.2-Chemical industry | 2580.83 | 91.46 | 79.62 | 1.41 | 27.02 | 17.90 | |
SEM | 31.833 | 0.392 | 0.357 | 0.087 | 0.340 | 0.299 | |
P-value | Significance | 0.273 | 1.000 | 0.578 | 0.901 | 0.941 | 0.999 |
Linear | 0.364 | 0.975 | 0.832 | 0.605 | 0.908 | 0.988 | |
Secondary | 0.254 | 0.993 | 0.883 | 0.673 | 0.893 | 0.998 | |
Table 5 Relative comparison of the effects of PQQ. Na on meat production performance of commercial broiler chickens
PQQ.Na2,mg/kg | Chicken weight,g | Half bore rate,% | Full bore rate,% | Abdominal fat percentage,% | Pectoral muscle rate,% | Leg muscle rate,% |
0 | 100.00 | 100.0 | 100.0 | 100.0 | 100.0 | 100.0 |
0.1 | 99.18 | 99.9 | 99.0 | 106.9 | 101.6 | 102.3 |
0.2 | 102.39 | 100.1 | 99.1 | 88.6 | 103.6 | 99.9 |
0.3 | 109.22 | 100.0 | 100.5 | 88.9 | 101.1 | 100.2 |
0.4 | 102.36 | 100.1 | 101.1 | 85.6 | 99.1 | 100.6 |
0.2-Chemical industry | 101.57 | 99.9 | 98.8 | 100.0 | 101.4 | 101.0 |
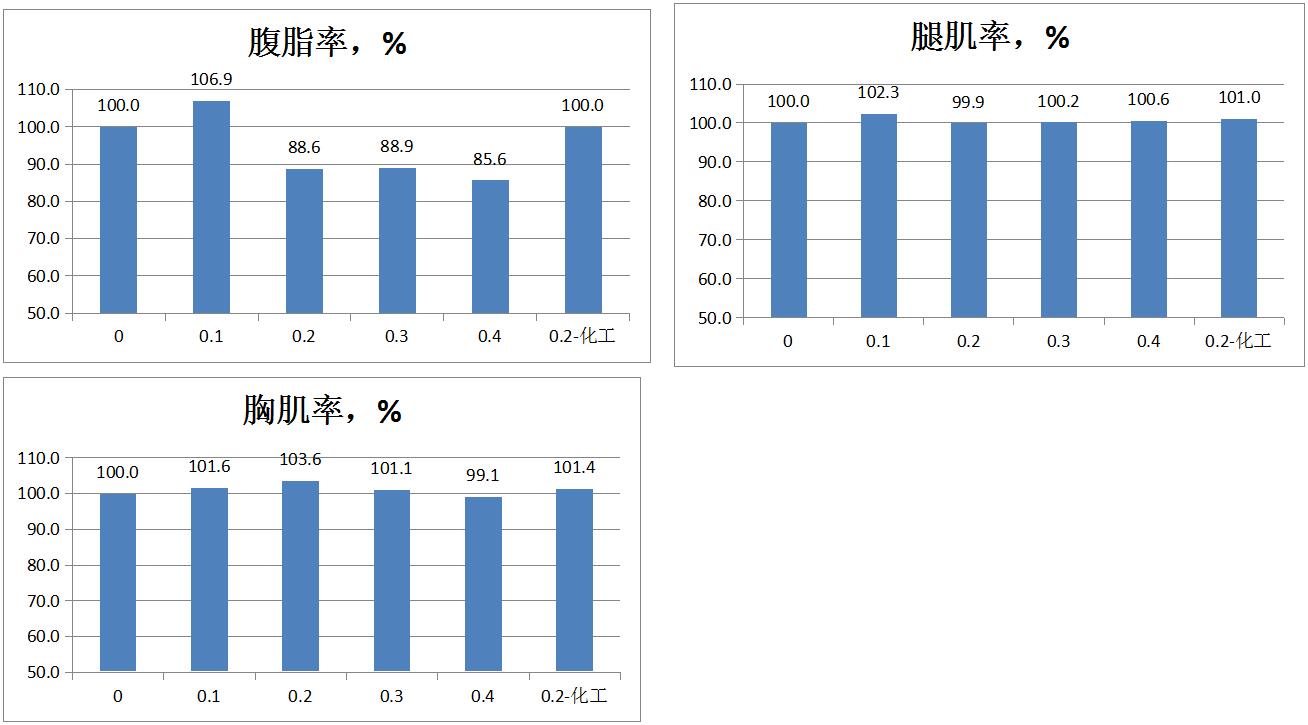
Table 6 Comparison of PQQ. Na's Economic Benefits in Improving Commercial Broiler Chickens
Control group | 0.1 | 0.2 | 0.3 | 0.4 | 0.2-Chemical industry | |
Chicken fry unit price, RMB/piece | 2.9 | 2.9 | 2.9 | 2.9 | 2.9 | 2.9 |
Selling weight, kg/piece | 2.82 | 2.83 | 2.84 | 2.9 | 2.79 | 2.83 |
Consumption of compound feed, kg/piece | 3.99 | 3.97 | 3.99 | 4.04 | 3.96 | 4 |
Chicken farming per ton of feed, per ton | 250.9 | 252 | 250.6 | 247.6 | 252.3 | 250 |
Chicken seedling cost, RMB/ton | 727.6 | 730.8 | 726.7 | 717.9 | 731.6 | 725.1 |
Chicken weight, kg/ton of feed | 707.8 | 713.1 | 711.4 | 717.4 | 704.9 | 706.8 |
Chicken unit price, RMB/kg | 8.7 | 8.7 | 8.7 | 8.7 | 8.7 | 8.7 |
Revenue from live chickens, RMB/ton of feed | 6158 | 6204 | 6189 | 6241 | 6133 | 6149 |
Basic feed unit price, RMB/ton | 4600 | 4600 | 4600 | 4600 | 4600 | 4600 |
PQQ unit price, RMB/kg | 26000 | 26000 | 26000 | 26000 | 26000 | 26000 |
PQQ cost, RMB/ton | 0 | 2.6 | 5.2 | 7.8 | 10.4 | 5.2 |
Total cost of feed, RMB per ton | 4600 | 4602.6 | 4605.2 | 4607.8 | 4610.4 | 4605.2 |
Gross profit margin, RMB/ton of material | 830 | 870 | 857 | 916 | 791 | 819 |
Gross profit, RMB/chicken | 3.31 | 3.45 | 3.42 | 3.7 | 3.13 | 3.28 |
Experimental group control group, RMB/ton of material | 0 | 39.96 | 26.97 | 85.47 | -39.48 | -11.23 |
Experimental group control group, RMB/chicken | 0 | 0.14 | 0.11 | 0.39 | -0.17 | -0.03 |
Control group | 0.1 | 0.2 | 0.3 | 0.4 | 0.2-Chemical industry | |
Chicken fry unit price, RMB/piece | 2.9 | 2.9 | 2.9 | 2.9 | 2.9 | 2.9 |
Selling weight, kg/piece | 2.82 | 2.83 | 2.84 | 2.9 | 2.79 | 2.83 |
Consumption of compound feed, kg/piece | 3.99 | 3.97 | 3.99 | 4.04 | 3.96 | 4 |
每吨饲料养鸡,只/吨 | 250.9 | 252 | 250.6 | 247.6 | 252.3 | 250 |
Chicken farming per ton of feed, per ton | 727.6 | 730.8 | 726.7 | 717.9 | 731.6 | 725.1 |
Chicken weight, kg/ton of feed | 707.8 | 713.1 | 711.4 | 717.4 | 704.9 | 706.8 |
Chicken unit price, RMB/kg | 8.7 | 8.7 | 8.7 | 8.7 | 8.7 | 8.7 |
Revenue from live chickens, RMB/ton of feed | 6158 | 6204 | 6189 | 6241 | 6133 | 6149 |
Basic feed unit price, RMB/ton | 4600 | 4600 | 4600 | 4600 | 4600 | 4600 |
PQQ unit price, RMB/kg | 26000 | 26000 | 26000 | 26000 | 26000 | 26000 |
PQQ cost, RMB/ton | 0 | 2.6 | 5.2 | 7.8 | 10.4 | 5.2 |
Total cost of feed, RMB per ton | 4600 | 4602.6 | 4605.2 | 4607.8 | 4610.4 | 4605.2 |
Gross profit margin, RMB/ton of material | 830 | 870 | 857 | 916 | 791 | 819 |
Gross profit, RMB/chicken | 3.31 | 3.45 | 3.42 | 3.7 | 3.13 | 3.28 |
Experimental group control group, RMB/ton of material | 0 | 39.96 | 26.97 | 85.47 | -39.48 | -11.23 |
Experimental group control group, RMB/chicken | 0 | 0.14 | 0.11 | 0.39 | -0.17 | -0.03 |