Zhu Zhengqi, Zhu Kai, Bao Yinghui, Li Zhaoyong, Yang Zaibin, Yang Weiren, Jiang Shuzhen
Shandong Agricultural University, Huanshan Group, SD BIOTECH GROUP
Abstract: In order to investigate the effects of Boluohui replacing Enramycin on piglet production performance, immune function, and intestinal health. 480 healthy 24 day old weaned ternary hybrid commercial piglets (half male and half female) with similar body weight were selected for the experiment, and randomly divided into 4 treatments, with 4 replicates per treatment and 40 piglets per replicate (see Table 1). Treatment 1: Feed a diet without any additives; Treatment 2: Feeding Boluohui; Treatment 3: Feeding with Enramycin; Treatment 4: Feed with Enramycin and Boluohui. Adopting a 2x2 factorial design, consisting of 2 antibiotic levels (Enramycin: 0 mg/kg vs. 75 mg/kg) and 2 Borui levels (Borui: 0 mg/kg vs. 200 mg/kg). The basic feed is formulated according to NRC standards and does not contain any antibiotics or plant extracts. The composition and nutritional levels of the feed are shown in Table 2. The experimental period lasted for 42 days, and all experimental pigs were slaughtered to determine their production performance. Blood samples were collected at 0, 14, and 42 days of the experimental period, and serum was separated and stored at -20 ℃ to measure immunoglobulin indicators (lgM, lgA, lgG). Rectal samples were removed before morning feeding to determine intestinal microbiota. The research results indicate that:
Production performance study: There was no significant difference between each group compared throughout the entire feeding period. However, adding 200 mg/kg of Boluohui to the diet showed a trend of increasing average daily weight gain (p=0.068), with no significant differences in average daily feed intake and feed to weight ratio compared to the baseline diet group. There were also no significant differences in mortality and diarrhea rates.
Serum antioxidant and immune responses: There were no significant differences among the four treatments on day 0. On the 14th day, feeding the enrofloxacin group did not improve the content of lgA and lgG immunoglobulin compared to the basal diet group, but significantly increased the content of lgM immunoglobulin (p<0.05); Compared with the basal diet group, feeding the Boluohui group did not significantly improve the content of lgA immunoglobulin, but feeding the Boluohui group significantly increased the content of lgG and lgM immunoglobulin (p<0.0001, p<0.0019); feeding the Enramycin group did not show significant differences compared with the Boluohui group. On the 42nd day, the group fed with enrofloxacin did not significantly improve the levels of lgA, lgG, and lgM immunoglobulin compared to the basal diet group, but there was an increasing trend in lgA (p=0.0582); Feeding the Boluohui group significantly increased the content of lgA, lgG, and lgM immunoglobulin compared to the basal diet group (p<0.001); Compared with the Boluohui group, the group fed with enrofloxacin did not improve the content of lgG and lgM immunoglobulin, but the group fed with Boluohui significantly increased the content of lgA immunoglobulin (p=0.0067).
Fecal microbiota study: There was no significant difference among the four treatments on day 0; On the 14th day, compared with the basal diet group, the group fed with enrofloxacin reduced the total number of fecal bacteria (p<0.05), while="" there="" was="" no="" significant="" difference="" in="" gut="" anaerobic="" lactic="" acid="" and="" salmonella="" p="">0.05). There was no significant difference (p>0.05) between the Boluohui feeding group and the basal diet group. There was no significant difference (p>0.05) between the group fed with enrofloxacin and the group fed with Boluohui; On the 42nd day, the number of Salmonella in each treatment was very low and no further comparison was made. Compared with the basal diet group, the group fed with enrofloxacin showed a significant decrease in total bacterial count and anaerobic lactic acid bacteria count (p<0.05), while="" there="" was="" no="" significant="" difference="" in="" gut="" microbiota="" count="" p="">0.05). Compared with the basal diet group, the number of anaerobic lactic acid bacteria in the Boluohui group significantly increased (p<0.05), while there was no significant difference in the total number of bacteria and intestinal bacteria. There was no significant difference between the Boluohui group and the Enramycin group when fed.
Keywords: Boluohui, production performance, immunoglobulin, fecal microbiota
1 Materials and Methods
1.1 Test Materials
Boluohui extract: Bai Qu Cai Hong alkaline ≥ 900 mg/kg, Xue Gen alkaline ≥ 1800mg/kg
1.2 Experimental Design
480 healthy 24 day old weaned three-way hybrid commercial piglets (half male and half female) with similar body weight (average weight: 5.04 ± 0.20 kg) were selected for the experiment and randomly divided into 4 treatments, with 4 replicates per treatment and 40 piglets per replicate (see Table 1). Adopting a 2x2 factorial design, consisting of 2 antibiotic levels (Enramycin: 0 mg/kg vs. 75 mg/kg) and 2 Borui levels (Borui: 0 mg/kg vs. 200 mg/kg). The basic feed is formulated according to NRC standards and does not contain any antibiotics or plant extracts. The experimental period is 42 days.
1.3 Production Performance
Weigh the piglets at the beginning and end of the formal trial period on a per replicate basis, calculate their daily weight gain, record their daily feed intake, calculate the average daily feed intake of weaned piglets, and calculate the feed to weight ratio. Calculate the mortality and diarrhea rates.
1.4 Fecal microbiota
At 0, 14, and 42 days of the experimental period, fecal samples were collected from the rectum before morning feeding to measure intestinal microbiota.
1.5 Immunoglobulin
Blood samples were collected at 0, 4, and 42 days of the experimental period, and serum was separated and stored at -20 ℃ for the determination of immunoglobulin indicators (lgM, lgA, lgG).
1.6 Data statistics and analysis
The experimental data was analyzed using the GLM process of SAS 9.2 software, and multiple comparisons were conducted using Duncan's method with P<0 05 serves as the criterion for determining the significance of differences.
2 Results and Analysis
2.1 Comparative analysis of production performance
From the comparison of the entire feeding period, as shown in Tables 2 and 3 and Figures 1, 2, and 3, there were no significant differences between each group. However, adding 200 mg/kg of Boluohui to the diet showed a trend of increasing average daily weight gain (p=0.068), with no significant differences in average daily feed intake and feed to weight ratio compared to the baseline diet group. There were also no significant differences in mortality and diarrhea rates. From a numerical analysis, with a basic diet treatment of 100%, fattening pigs were fed Boluohui for 42 days. The average daily weight gain, average daily feed intake, feed to weight ratio, mortality rate, and diarrhea rate were 101.2%, 100.1%, 98.7%, 89.6%, and 89.6%, respectively. This proves that adding 200 mg/kg Boluohui extract to the diet of fattening pigs may improve their production performance.
2.2 Serum immunoglobulin
At 0d, as shown in Tables 4 and 5, there were no significant differences among the four treatments.
On the 14th day, as shown in Tables 6, 7, and Figures 4, 5, and 6, the group fed with enrofloxacin did not improve the content of lgA and lgG immunoglobulin compared to the basal diet group, but significantly increased the content of lgM immunoglobulin (p<0.05); Compared with the basal diet group, feeding the Boluohui group did not significantly improve the content of lgA immunoglobulin, but feeding the Boluohui group significantly increased the content of lgG and lgM immunoglobulin (p<. 0001, p<0.0019); feeding the Enramycin group did not show significant differences compared with the Boluohui group. From a numerical analysis, with a basal diet treatment of 100%, fattening pigs fed Boluohui for 14 days had serum IgA, IgG, and IgM levels of 102.0%, 106.1%, and 103.7%, respectively. This indicates that Boluohui can increase IgG and IgM and improve immune function. Feeding Boluohui can enhance the immune system of fattening pigs, and the effect is better than adding 75 mg/kg enrofloxacin to the basic diet.
On the 42nd day, as shown in Tables 8, 9, and Figures 7, 8, and 9, the group fed with enrofloxacin did not significantly improve the levels of lgA, lgG, and lgM immunoglobulin compared to the basal diet group, but there was an increasing trend in lgA (p=0.0582); Feeding the Boluohui group significantly increased the content of lgA, lgG, and lgM immunoglobulin compared to the basal diet group (p<0.001); Compared with the Boluohui group, the group fed with enrofloxacin did not improve the content of lgG and lgM immunoglobulin, but the group fed with Boluohui significantly increased the content of lgA immunoglobulin (p=0.0067). From a numerical analysis, with a basal diet treatment of 100%, fattening pigs fed Boluohui for 42 days had serum IgA, IgG, and IgM levels of 106.3%, 104.7%, and 106.1%, respectively. This indicates that Boluohui can increase IgA, IgG, and IgM and improve immune function; Fat pigs were fed with enrofloxacin for 42 days, and the serum levels of IgA, IgG, and IgM were 103.5%, 100.9%, and 103.0%, respectively.
This indicates that Enramycin increased IgA, IgG, and IgM levels; But the effect was not as good as feeding the Boluohui group to enhance immune function.
2.3 Comparative analysis of fecal microbiota
On the 0th day, as shown in Tables 10 and 11, there were no significant differences among the four treatments.
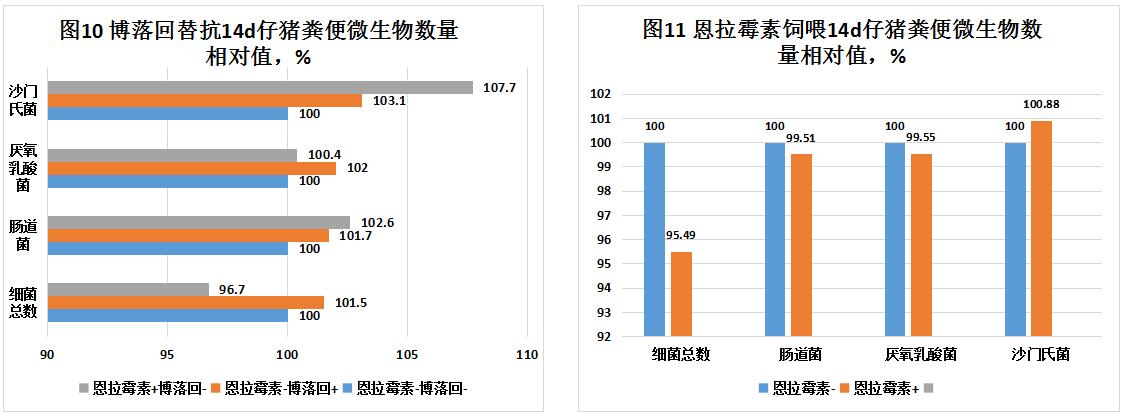
On the 14th day, as shown in Table 12, Table 13, and Figures 10, 11, and 12, the group fed with enrofloxacin reduced the total number of fecal bacteria compared to the basal diet group (p<0.05), while="" there="" were="" no="" significant="" differences="" in="" gut="" anaerobic="" lactic="" acid="" and="" salmonella="" p="">0.05). There was no significant difference (p>0.05) between the Boluohui feeding group and the basal diet group. There was no significant difference (p>0.05) between the group fed with enrofloxacin and the group fed with Boluohui. From a numerical analysis, with a basic diet treatment of 100%, fattening pigs fed Boluohui for 14 days had a total fecal bacterial count, intestinal bacteria, anaerobic lactic acid bacteria, and Salmonella of 101.5%, 101.7%, 102.0%, and 103.1%, respectively; After 14 days of feeding Enlamycin to fattening pigs, the total number of fecal bacteria, intestinal bacteria, anaerobic lactic acid bacteria, and Salmonella were 96.7%, 102.6%, 100.4%, and 107.7%, respectively. This indicates that Boluohui can have the function of improving the gut microbiota.
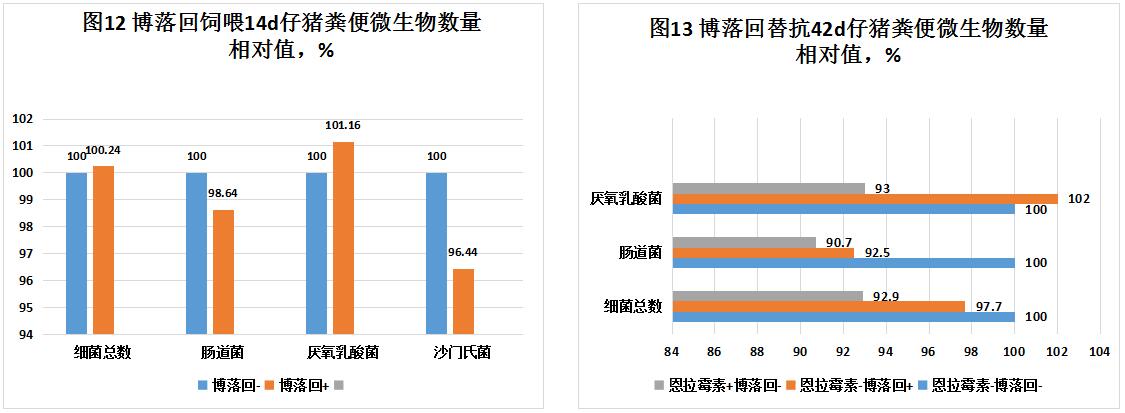
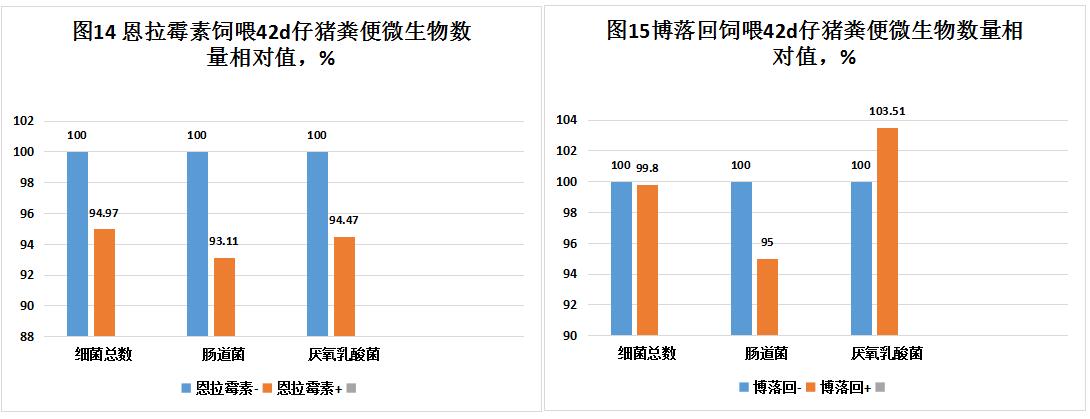
On the 42nd day, as shown in Table 14, Table 15 and Figure 13, Figure 14, Figure 15, the number of Salmonella in each treatment was very small and will not be compared again. Compared with the basal diet group, the group fed with enrofloxacin showed a significant decrease in total bacterial count and anaerobic lactic acid bacteria count (p<0.05), while="" there="" was="" no="" significant="" difference="" in="" gut="" microbiota="" count="" p="">0.05). Compared with the basal diet group, the number of anaerobic lactic acid bacteria in the Boluohui group significantly increased (p<0.05), while there was no significant difference in the total number of bacteria and intestinal bacteria. There was no significant difference between the Boluohui group and the Enramycin group when fed. From a numerical analysis, with a basic diet treatment of 100%, fattening pigs were fed Boluohui for 42 days, and the total number of fecal bacteria, intestinal bacteria, and anaerobic lactic acid bacteria were 97.7%, 92.5%, and 102.0%, respectively; The total number of fecal bacteria, intestinal bacteria, and anaerobic lactic acid bacteria in fattening pigs fed with enrofloxacin for 42 days were 92.9%, 90.7%, and 93.0%, respectively. This indicates that Boluohui can have the function of improving intestinal microbiota, and the effect is better than adding 75 mg/kg enrofloxacin to the basic diet.
3 Conclusion
Adding 200 mg/kg of Boluohui to the diet of piglets has a trend of increasing average daily weight gain and may improve the production performance of fattening pigs.
3.2 Adding Boluohui to the piglet diet significantly increased the content of lgA, lgG, and lgM immunoglobulin compared to the basal diet group; Compared with the group fed with enrofloxacin, the group fed with Boluohui significantly increased the content of lgA immunoglobulin, indicating that adding 200 mg/kg Boluohui to the basal diet can enhance the immunity of piglets, and the effect is better than adding 75 mg/kg enrofloxacin to the basal diet.
Adding Boluohui to the diet of piglets significantly increased the number of anaerobic lactic acid bacteria and improved the gut microbiota environment, and the effect was better than adding 75 mg/kg Enramycin to the basal diet.
Adding Boluohui 200 mg/kg to the diet of piglets may improve the production performance of fattening pigs, enhance immunity, and improve gut microbiota. The effect is better than adding 75 mg/kg Enramycin to the basic diet.
Table 1 Experimental Design
Handle | Enramycin,mg/kg | Macleaya cordata,mg/kg | Repetitions | Number of pigs/Repetition | Total number of pigs |
1 | 0 | 0 | 4 | 40 | 160 |
2 | 200 | 4 | 40 | 160 | |
3 | 75 | 0 | 4 | 40 | 160 |
4 | 200 | 4 | 40 | 160 | |
Amount to | 640 |
Table 2 Effects of Boluohui and Enramycin on the Production Performance of Weaned Piglets, lg (cfu)/g
Enramycin,mg/kg | Macleaya cordata,mg/kg | ADG,g/d | ADFI,g/d | F/G | Mortality rate,% | Diarrhea rate,% |
- | - | 507.6 | 702.5 | 1.386 | 3.89 | 3.89 |
+ | 513.7 | 702.9 | 1.368 | 3.49 | 3.49 | |
+ | - | 494.6 | 693.4 | 1.404 | 3.39 | 3.39 |
+ | 511.7 | 706.3 | 1.381 | 3.56 | 3.56 | |
SEM | ||||||
pooled | ||||||
Enramycin | - | 510.7 | 702.7 | 1.377 | 3.69 | 3.69 |
+ | 503.1 | 699.8 | 1.392 | 3.48 | 3.48 | |
Macleaya cordata | - | 501.1 | 697.9 | 1.395 | 3.64 | 3.64 |
+ | 512.7 | 704.6 | 1.375 | 3.53 | 3.53 | |
p-value | ||||||
Enramycin + v s- | 0.366 | 0.757 | 0.411 | 0.668 | 0.668 | |
Macleaya cordata + v s- | 0.068 | 0.481 | 0.261 | 0.821 | 0.821 | |
Enramycin vs Macleaya cordata | 0.509 | 0.508 | 0.885 | 0.559 | 0.559 | |
Table 3 Relative values of the effects of Boluohui and Enramycin on the production performance of weaned piglets,%
Enramycin,mg/kg | Macleaya cordata,mg/kg | ADG,g/d | ADFI,g/d | F/G | Mortality rate,% | Diarrhea rate,% | |
- | - | 100.0 | 100.0 | 100.0 | 100.0 | 100.0 | |
+ | 101.2 | 100.1 | 98.7 | 89.6 | 89.6 | ||
+ | - | 97.4 | 98.7 | 101.3 | 87.1 | 87.1 | |
+ | 100.8 | 100.5 | 99.6 | 91.7 | 91.7 | ||
pooled | |||||||
Enramycin | - | 100.0 | 100.0 | 100.0 | 100.0 | 100.0 | |
+ | 98.5 | 99.6 | 101.1 | 94.3 | 94.3 | ||
Macleaya cordata | - | 100.0 | 100.0 | 100.0 | 100.0 | 100.0 | |
+ | 102.3 | 101.0 | 98.5 | 96.9 | 96.9 | ||
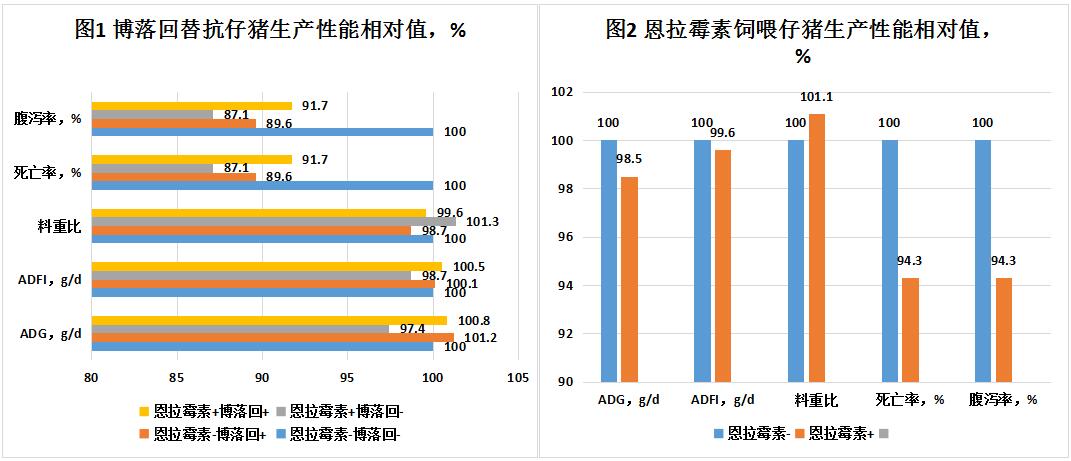
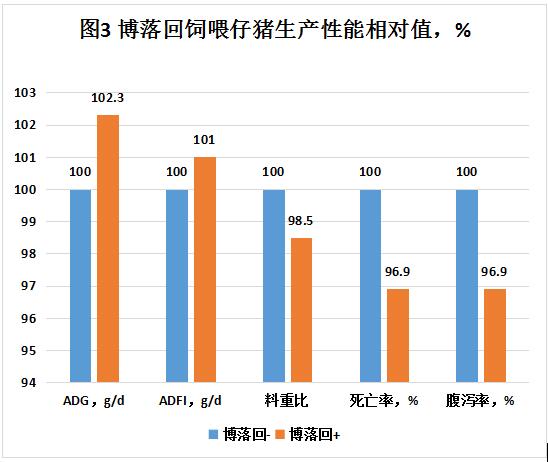
Table 4: Effects of Boluohui and Enramycin on Serum Immunoglobulin in Piglets at 0d Test, ug/ml
Enramycin,mg/kg | Macleaya cordata,mg/kg | lgA | lgG | lgM |
- | - | 32.44 | 238.06 | 35.54 |
+ | 32.81 | 240.57 | 35.76 | |
+ | - | 32.40 | 237.30 | 35.57 |
+ | 32.55 | 236.51 | 35.89 | |
SEM | ||||
pooled | ||||
Enramycin | - | 32.63 | 239.31 | 35.65 |
+ | 32.48 | 236.91 | 35.73 | |
Macleaya cordata | - | 32.42 | 237.68 | 35.55 |
+ | 32.68 | 238.54 | 35.83 | |
p-value | ||||
Enramycin + v s- | 0.576 | 0.265 | 0.723 | |
Macleaya cordata + v s- | 0.335 | 0.688 | 0.230 | |
Enramycin vs Macleaya cordata | 0.682 | 0.443 | 0.810 | |
Table 5 Relative values of the effects of Boluohui and Enramycin on serum immunoglobulin in piglets during the 0d experiment,%
Enramycin,mg/kg | Macleaya cordata,mg/kg | lgA | lgG | lgM |
- | - | 100 | 100 | 100 |
+ | 101.1 | 101.1 | 100.6 | |
+ | - | 99.9 | 99.7 | 100.1 |
+ | 100.3 | 99.4 | 101.0 | |
pooled | ||||
Enramycin | - | 100.00 | 100.00 | 100.00 |
+ | 99.54 | 98.99 | 100.22 | |
Macleaya cordata | - | 100.00 | 100.00 | 100.00 |
+ | 100.79 | 100.36 | 100.77 | |
Table 6: Effects of Boluohui and Enramycin on Serum Immunoglobulin in Piglets after 14 Days of Experiment, ug/ml
Enramycin,mg/kg | Macleaya cordata,mg/kg | lgA | lgG | lgM |
- | - | 37.16 | 270.51 | 41.35 |
+ | 37.89 | 286.93 | 42.90 | |
+ | - | 37.74 | 269.74 | 42.64 |
+ | 38.15 | 293.49 | 43.72 | |
SEM | ||||
pooled | ||||
Enramycin | - | 37.52 | 278.72 | 42.13 |
+ | 37.94 | 281.62 | 43.18 | |
Macleaya cordata | - | 37.45 | 270.12 | 42.00 |
+ | 38.02 | 290.21 | 43.31 | |
p-value | ||||
Enramycin + v s- | 0.3117 | 0.1408 | 0.0111 | |
Macleaya cordata + v s- | 0.1696 | <.0001 | 0.0019 | |
Enramycin vs Macleaya cordata | 0.6954 | 0.064 | 0.5637 | |
Table 7 Relative values of the effects of Boluohui and Enramycin on serum immunoglobulin in piglets during the 14 day experiment,%
Enramycin,mg/kg | Macleaya cordata,mg/kg | lgA | lgG | lgM |
- | - | 100 | 100 | 100 |
+ | 102.0 | 106.1 | 103.7 | |
+ | - | 101.6 | 99.7 | 103.1 |
+ | 102.7 | 108.5 | 105.7 | |
pooled | ||||
Enramycin | - | 100.00 | 100.00 | 100.00 |
+ | 101.12 | 101.04 | 102.50 | |
Macleaya cordata | - | 100.00 | 100.00 | 100.00 |
+ | 101.53 | 107.44 | 103.13 | |
Table 8: Effects of Boluohui and Enramycin on Serum Immunoglobulin in Piglets after 42 Days of Experiment, ug/ml
Enramycin | Macleaya cordata | lgA | lgG | lgM |
- | - | 40.65 | 316.33 | 40.35 |
+ | 43.21 | 331.14 | 42.80 | |
+ | - | 42.08 | 319.26 | 41.57 |
+ | 42.94 | 339.07 | 43.48 | |
SEM | ||||
pooled | ||||
Enramycin | - | 41.93 | 323.73 | 41.57 |
+ | 42.51 | 329.17 | 42.52 | |
Macleaya cordata | - | 41.36 | 317.79 | 40.96 |
+ | 43.07 | 335.11 | 43.14 | |
p-value | ||||
Enramycin + v s- | 0.0582 | 0.1417 | 0.1024 | |
Macleaya cordata + v s- | <.0001 | <.0001 | 0.0004 | |
Enramycin vs Macleaya cordata | 0.0067 | 0.4943 | 0.6395 | |
Table 9 Relative values of the effects of Boluohui and Enramycin on serum immunoglobulin in piglets after 42 days of experiment,%
Enramycin,mg/kg | Macleaya cordata,mg/kg | lgA | lgG | lgM |
- | - | 100 | 100 | 100 |
+ | 106.3 | 104.7 | 106.1 | |
+ | - | 103.5 | 100.9 | 103.0 |
+ | 105.6 | 107.2 | 107.7 | |
pooled | ||||
Enramycin | - | 100.00 | 100.00 | 100.00 |
+ | 101.39 | 101.68 | 102.28 | |
Macleaya cordata | - | 100.00 | 100.00 | 100.00 |
+ | 104.13 | 105.45 | 105.31 | |
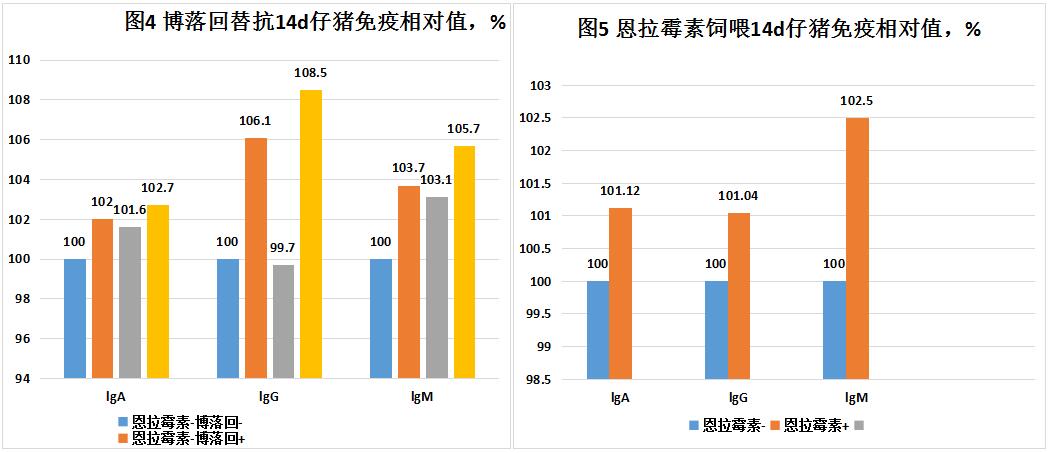
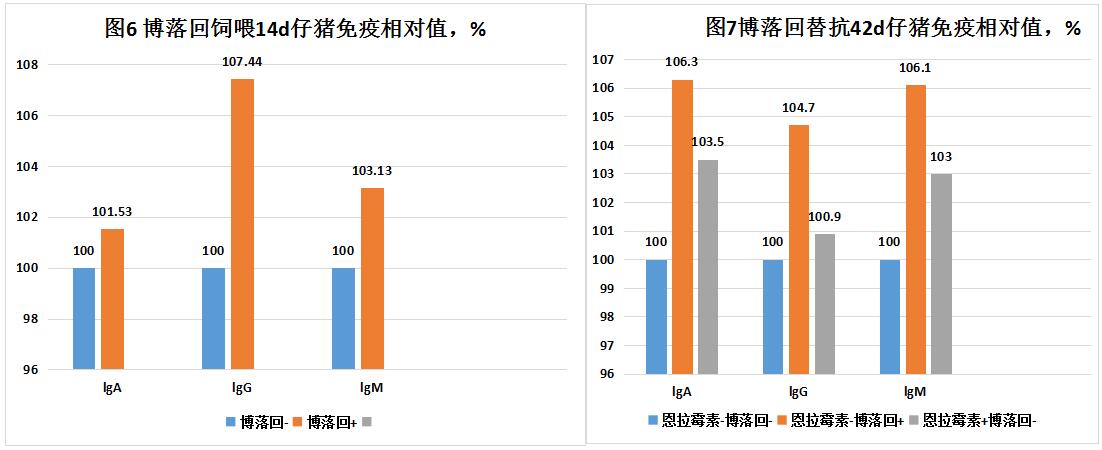
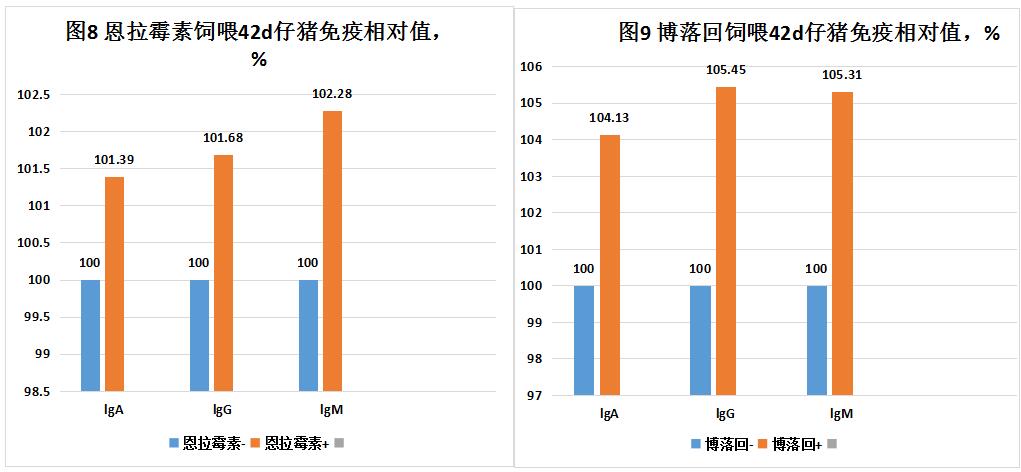
Table 10: Effects of Boluohui and Enramycin on Fecal Microorganisms in Piglets at 0d Experiment, lg (cfu)/g
Enramycin,mg/kg | Macleaya cordata,mg/kg | Total bacterial count | Intestinal bacteria | Anaerobic lactic acid bacteria | Salmonella |
- | - | 8.27 | 7.57 | 7.96 | 3.27 |
+ | 8.27 | 7.57 | 7.97 | 3.35 | |
+ | - | 8.26 | 7.53 | 8.10 | 3.30 |
+ | 8.20 | 7.52 | 8.04 | 3.30 | |
SEM | |||||
pooled | |||||
Enramycin | - | 8.27 | 7.57 | 7.96 | 3.31 |
+ | 8.23 | 7.52 | 8.07 | 3.30 | |
Macleaya cordata | - | 8.26 | 7.55 | 8.03 | 3.29 |
+ | 8.23 | 7.54 | 8.01 | 3.32 | |
p-value | |||||
Enramycin + v s- | 0.6603 | 0.6444 | 0.3889 | 0.935 | |
Macleaya cordata + v s- | 0.7342 | 0.985 | 0.8576 | 0.7064 | |
Enramycin vs Macleaya cordata | 0.7632 | 0.9494 | 0.7856 | 0.6992 | |
Table 11: Relative comparison of the effects of Boluohui and Enramycin on fecal microbiota in piglets during the 0-day experiment,%
Enramycin,mg/kg | Macleaya cordata,mg/kg | Total bacterial count | Intestinal bacteria | Anaerobic lactic acid bacteria | Salmonella |
- | - | 100 | 100 | 100 | 100 |
+ | 100.0 | 100.1 | 100.1 | 102.4 | |
+ | - | 99.8 | 99.5 | 101.7 | 100.9 |
+ | 99.2 | 99.4 | 101.0 | 100.9 | |
pooled | |||||
Enramycin | - | 100.00 | 100.00 | 100.00 | 100.00 |
+ | 99.52 | 99.38 | 101.31 | 99.75 | |
Macleaya cordata | - | 100.00 | 100.00 | 100.00 | 100.00 |
+ | 99.63 | 99.97 | 99.73 | 101.16 | |
Table 12: Effects of Boluohui and Enramycin on Fecal Microorganisms in Piglets after 14 Days of Experiment, lg (cfu)/g
Enramycin,mg/kg | Macleaya cordata,mg/kg | Total bacterial count | Intestinal bacteria | Anaerobic lactic acid bacteria | Salmonella |
- | - | 8.20 | 6.45 | 7.90 | 3.39 |
+ | 8.32 | 6.56 | 8.06 | 3.49 | |
+ | - | 7.93 | 6.62 | 7.93 | 3.65 |
+ | 7.84 | 6.33 | 7.95 | 3.29 | |
SEM | |||||
pooled | |||||
Enramycin | - | 8.26 | 6.50 | 7.98 | 3.44 |
+ | 7.89 | 6.47 | 7.94 | 3.47 | |
Macleaya cordata | - | 8.06 | 6.53 | 7.91 | 3.52 |
+ | 8.08 | 6.44 | 8.01 | 3.39 | |
p-value | |||||
Enramycin + v s- | 0.0019 | 0.7592 | 0.6696 | 0.8115 | |
Macleaya cordata + v s- | 0.8669 | 0.3891 | 0.2849 | 0.3289 | |
Enramycin vs Macleaya cordata | 0.3666 | 0.06 | 0.4113 | 0.0753 | |
Table 13: Relative comparison of the effects of Boluohui and Enramycin on fecal microbiota in piglets during a 14 day experiment,%
Enramycin,mg/kg | Macleaya cordata,mg/kg | Total bacterial count | Intestinal bacteria | Anaerobic lactic acid bacteria | Salmonella |
- | - | 100 | 100 | 100 | 100 |
+ | 101.5 | 101.7 | 102.0 | 103.1 | |
+ | - | 96.7 | 102.6 | 100.4 | 107.7 |
+ | 95.7 | 98.1 | 100.7 | 97.2 | |
pooled | |||||
Enramycin | - | 100.00 | 100.00 | 100.00 | 100.00 |
+ | 95.49 | 99.51 | 99.55 | 100.88 | |
Macleaya cordata | - | 100.00 | 100.00 | 100.00 | 100.00 |
+ | 100.24 | 98.64 | 101.16 | 96.44 | |
Table 14: Effects of Boluohui and Enramycin on Fecal Microorganisms in Piglets after 42 Days of Experiment, lg (cfu)/g
Enramycin,mg/kg | Macleaya cordata | Total bacterial count | Intestinal bacteria | Anaerobic lactic acid bacteria | Salmonella |
- | - | 7.86 | 5.31 | 7.52 | <3.00 |
+ | 7.68 | 4.92 | 7.67 | <3.00 | |
+ | - | 7.30 | 4.82 | 6.99 | <3.00 |
+ | 7.45 | 4.71 | 7.35 | <3.00 | |
SEM | |||||
pooled | |||||
Enramycin | - | 7.77 | 5.11 | 7.59 | <3.00 |
+ | 7.38 | 4.76 | 7.17 | <3.00 | |
Macleaya cordata | - | 7.58 | 5.06 | 7.25 | <3.00 |
+ | 7.57 | 4.81 | 7.51 | <3.00 | |
p-value | |||||
Enramycin + v s- | 0.008 | 0.179 | 0.002 | - | |
Macleaya cordata + v s- | 0.914 | 0.331 | 0.047 | - | |
Enramycin vs Macleaya cordata | 0.238 | 0.582 | 0.413 | - | |
Table 15 Relative comparison of the effects of Boluohui and Enramycin on fecal microbiota in piglets after 42 days of experiment,%
Enramycin,mg/kg | Macleaya cordata,mg/kg | Total bacterial count | Intestinal bacteria | Anaerobic lactic acid bacteria | Salmonella |
- | - | 100 | 100 | 100 | - |
+ | 97.7 | 92.5 | 102.0 | - | |
+ | - | 92.9 | 90.7 | 93.0 | - |
+ | 94.8 | 88.6 | 97.8 | - | |
pooled | |||||
Enramycin | - | 100.00 | 100.00 | 100.00 | - |
+ | 94.97 | 93.11 | 94.47 | - | |
Macleaya cordata | - | 100.00 | 100.00 | 100.00 | - |
+ | 99.80 | 95.00 | 103.51 | - | |