Sun Guangchao, Li Chaoxia, Bian Leyi, Li Zhaoyong, Sun Yi, Yang Zaibin, Yang Weiren
SD BIOTECH GROUP
Shandong Agricultural University
Abstract: In order to study the effect of adding different levels of Yanning 10 to the diet on commercial broiler chickens, this experiment selected 960 healthy 1-day-old AA broiler chickens with similar body weight, and randomly divided them into 4 treatments, with 12 replicates in each treatment and 20 chickens in each replicate. The control group was fed with a basic diet (commercial diet), while the experimental group was supplemented with 200 mg/kg, 400 mg/kg, and 800 mg/kg of Yanning 10 on top of the control group's diet. The experiment is divided into two stages (0-21 days; 22-42 days). Experimental chicken cage feeding with pellet feed.
The research results indicate that:
Comparative analysis of production performance: Compared with the control group, adding different levels of Yanning 10 to the diet can linearly and secondarily reduce the feed to weight ratio of broiler chickens (1-21 days, 22-42 days, 1-42 days) (P<0.05), but="" has="" no="" significant="" effect="" on="" the="" daily="" feed="" intake="" of="" broiler="" chickens="" 1-21="" 22-42="" 1-42="" p="">0.05). Taking the control group as 100%, adding 10400 mg/kg of Yanning to the diet can increase daily weight gain (1-42 days), body weight (21 days, 42 days) by 4.4%, 5.3%, and 2.9%, respectively, with the most significant improvement in production performance.
Comparative analysis of meat production performance: Compared with the control group, the addition of different levels of Yanning 10 to the diet had no significant effect on the carcass indicators of broiler chickens at 21 days (P>0.05), but could linearly and secondarily increase the full bore rate of broiler chickens at 42 days (P<0.05), and linearly and secondarily reduce the abdominal fat rate of broiler chickens at 42 days (P<0.05).
Comparative analysis of immune index: Compared with the control group, adding different levels of Yanning 10 to the diet did not show linear or quadratic correlation in the immune organ index of broiler chickens (P>0.05). Adding 10400 mg/kg of Yanning to the diet of broiler chickens for 42 days increased the thymus index, bursa index, and spleen index of broiler chickens by 22.8%, 28.7%, and 7.0%, respectively, with a control group of 100%.
Comparative analysis of digestive tract development: Compared with the control group, adding different levels of Yanning 10 to the diet had no linear relationship with 21 day digestive tract development in broiler chickens (P>0.05), but could linearly increase small intestine length and total digestive tract length in broiler chickens at 42 days (P<0.05), and linearly and secondarily increase small intestine weight, total digestive tract weight, and relative digestive tract weight (P<0.05).
Keywords: Yanning 10; Commercial broiler chickens; Production performance; Meat production performance; Digestive tract development
1 Materials and Methods
1.1 Test Materials
Yanning 10: Plant extract compound product. Provided by SD BIOTECH GROUP.
1.2 Experimental animals and design
960 healthy 1-day-old AA broiler chickens with similar body weight were selected and randomly divided into 4 treatments, with 12 replicates per treatment and 20 chickens per replicate (see Table 1). The experiment adopts a single factor experimental design: treatment 1, control group, fed with basic diet (commodity diet); For treatments 2, 3, and 4, Yanning 10 was added to the control group at doses of 200 mg/kg, 400 mg/kg, and 800 mg/kg, respectively. The experiment is divided into two stages (0-21d and 22-42d). Experimental chicken cage feeding with pellet feed. The experimental basic diet was formulated with reference to the conventional diet of the breeding farm. The detailed composition and nutritional level of the diet are shown in Table 2.
1.2 Measurement indicators
Production performance: Record daily feed intake and remaining feed amount, conduct 21 and 42 day experiments, and weigh. Calculate daily weight gain, daily feed intake, and feed to gain ratio; Record daily disease and death situations, calculate the death rate and European index.
Meat production performance: Chicken experiments were conducted for 21 and 42 days, with 6 chickens randomly selected from each treatment (1 chicken/replicate) for slaughter. Half clean bore rate, full clean bore rate, abdominal fat rate, leg muscle rate, and chest muscle rate were measured.
Immune indicators: Immune organ index: At 21 and 42 days of broiler experiment, 6 chickens were randomly selected from each treatment (1 chicken/replicate), and the spleen, thymus, and bursa of Fabricius were taken to calculate the spleen, thymus, and bursa of Fabricius index.
Digestive tract development: At 21 and 42 days of the experiment, 6 chickens (1 per replicate) were randomly selected from each treatment, and their digestive tracts were freed to measure the length and weight of the digestive tracts (small and large intestine).
1.3 Data statistics and analysis
The experimental data was analyzed using the GLM process of SAS 9.2 software, and multiple comparisons were conducted using Duncan's method with P<0 05 serves as the criterion for determining the significance of differences.
2 Results and Analysis
2.1 Comparative analysis of production performance
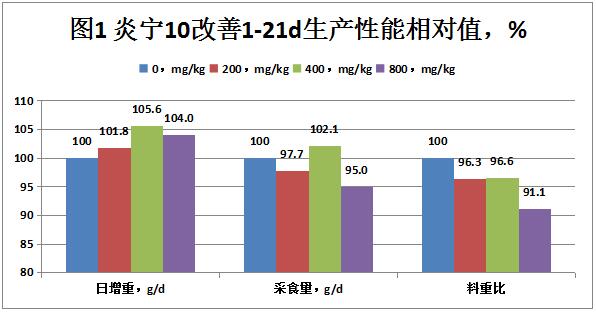
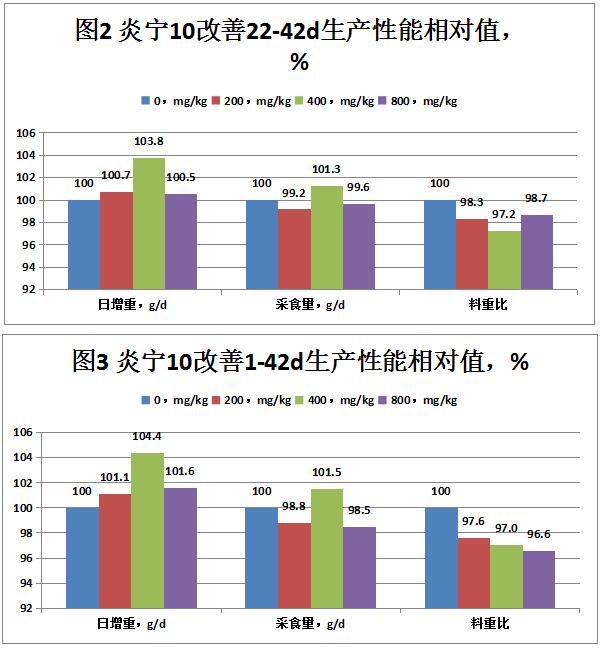
The effects of adding different levels of Yanning 10 to the diet on the production performance and body weight of broiler chickens are shown in Table 3, Figure 1, Figure 2, Figure 3, Figure 4, and Figure 5. Compared with the control group, adding Yanning 10 at 200 mg/kg, 400 mg/kg, and 800 mg/kg to the diet significantly increased the body weight and daily weight gain of broiler chickens at 21 and 42 days (P<0.05), significantly reduced the feed to weight ratio at 1-21 and 1-42 days (P<0.05), and showed a decreasing trend for the feed to weight ratio at 22-42 days (P=0.056). Significantly reduced the daily feed intake from 1-21 days (P<0.05), but="" had="" no="" significant="" effect="" on="" the="" daily="" feed="" intake="" of="" broiler="" chickens="" from="" 22-42="" days="" and="" 1-42="" p="">0.05). Moreover, adding different concentrations of Yanning 10 to the diet resulted in a linear and quadratic decrease in feed to weight ratio for broiler chickens at 1-21, 22-42, and 1-42 days (P<0.05). Taking the control group as 100%, adding 10200 mg/kg of Yanning to the diet increased daily weight gain and feed intake by 1.8%, 2.3%, 0.7%, 0.8%, 1.1%, and 1.2%, respectively, on days 1-21, 22-42, and 1-42. The feed to weight ratio decreased by 3.7%, 1.7%, and 2.4%, and the body weight of broiler chickens increased by 1.7% and 1.1% on days 21 and 42, respectively. Adding 10400 mg/kg of Yanning to the diet increased daily weight gain and feed intake by 5.6%, 2.1%, 3.8%, 1.3%, 4.4%, and 1.5%, respectively, on days 1-21, 22-42, and 1-42. The feed to weight ratio decreased by 3.4%, 2.8%, and 3.0%, and the body weight of broiler chickens increased by 5.3% and 2.9% on days 21 and 42, respectively. Adding 10800 mg/kg of Yanning to the diet increased daily weight gain by 4.0%, 0.5%, and 1.6% at 1-21 days, 22-42 days, and 1-42 days, respectively. Daily feed intake decreased by 5.0%, 0.4%, and 1.5%, and feed to weight ratio decreased by 8.9%, 1.3%, and 3.4%. The body weight of broiler chickens increased by 3.8% and 1.6% at 21 days and 42 days, respectively. Based on the above analysis, adding 10400 mg/kg of Yanning to the diet can achieve better production performance and the best effect for broiler chickens.
2.2 Comparative analysis of meat production performance
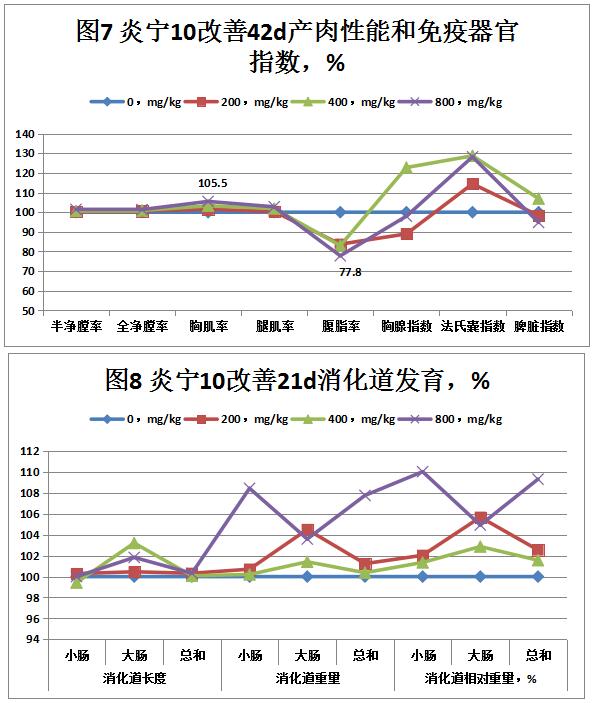
The effects of adding different levels of Yanning 10 on the meat production performance of broiler chickens are shown in Table 4, Table 5, Figures 6 and 7. Compared with the control group, adding different concentrations of Yanning 10 to the diet had no significant effect on the meat production performance of broiler chickens at 21 days (P>0.05). However, there was a significant increase in the chest muscle percentage of broiler chickens at 42 days (P<0.05), with a trend of increasing the total clearance rate (p=0.057) and showing a linear (p<0.01) and quadratic (p<0.05) increase pattern, and a trend of decreasing abdominal fat percentage (p=0.076) and showing a linear and quadratic decrease pattern (p<0.05). Taking the control group as 100%, adding 10200 mg/kg of Yanning to the diet resulted in an increase of 0.9%, 1.7%, 3.7%, and 2.7% in the half empty chamber rate, full empty chamber rate, chest muscle rate, and leg muscle rate, respectively, after 21 days. After 42 days, the half empty chamber rate, full empty chamber rate, chest muscle rate, and leg muscle rate increased by 0.3%, 0.7%, 1.6%, and 0.3%, respectively, and the abdominal fat rate decreased by 16.3%; Adding 10400 mg/kg of Yanning to the diet resulted in an increase of 1.0%, 0.9%, 1.8%, and 3.1% in the semi empty chamber rate, full empty chamber rate, chest muscle rate, and leg muscle rate, respectively, at 21 days. At 42 days, the semi empty chamber rate, full empty chamber rate, chest muscle rate, and leg muscle rate increased by 0.6%, 0.9%, 3.2%, and 1.9%, respectively, while the abdominal fat rate decreased by 17.0%; Adding 10800 mg/kg of Yanning to the diet resulted in an increase of 1.2%, 0.9%, 2.5%, and 2.0% in the semi empty chamber rate, full empty chamber rate, chest muscle rate, and leg muscle rate, respectively, after 21 days. After 42 days, the semi empty chamber rate, full empty chamber rate, chest muscle rate, and leg muscle rate increased by 1.5%, 1.3%, 5.5%, and 2.8%, respectively, while the abdominal fat rate decreased by 22.2%.
2.3 Comparative analysis of immune indicators
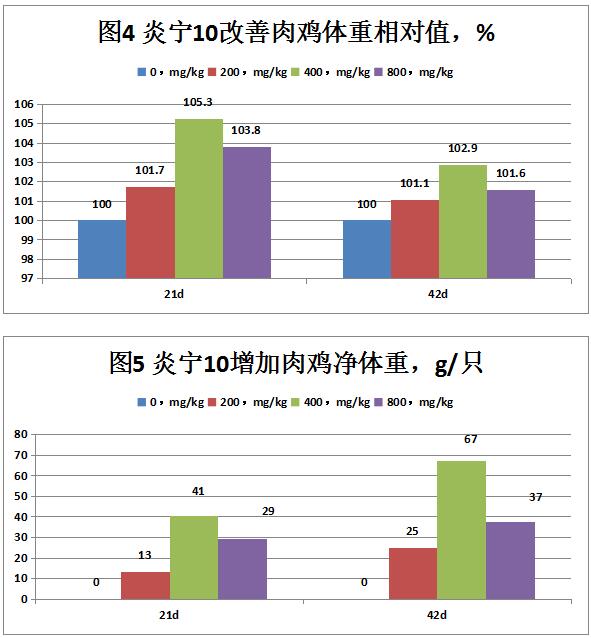
The effects of adding different levels of Yanning 10 on the immune organ index of broiler chickens are shown in Tables 4, 5, 6, and 7. Compared with the control group, adding different concentrations of Yanning 10 to the diet significantly reduced the bursa index of broiler chickens after 21 days (p<0.001) and showed a linear (p=0.001) and quadratic (p<0.001) decrease pattern. There was no significant effect on thymus index and spleen index. There was a decreasing trend in thymus index of broiler chickens at 42 days (p=0.087). Taking the control group as 100%, adding 10200 mg/kg of Yanning to the diet of broiler chickens increased the thymus index by 9.3% at 21 days, decreased the bursa index and spleen index by 31.7% and 5.4% respectively, increased the bursa index by 14.4% at 42 days, and decreased the thymus index and spleen index by 11.0% and 1.7% respectively; Adding 10200 mg/kg of Yanning increased the thymus index of broiler chickens by 8.8% at 21 days, while the bursa index and spleen index decreased by 36.0% and 6.6%, respectively. The thymus index, bursa index, and spleen index of broiler chickens increased by 22.8%, 28.7%, and 7.0% at 42 days, respectively. Adding 10800 mg/kg of Yanning increased the thymus index and spleen index of broiler chickens by 19.8% and 2.2% at 21 days, while the bursa index decreased by 27.9%. The bursa index of broiler chickens increased by 28.2% at 42 days, while the thymus index and spleen index decreased by 2.0% and 5.2%, respectively.
2.4 Comparative analysis of digestive tract development
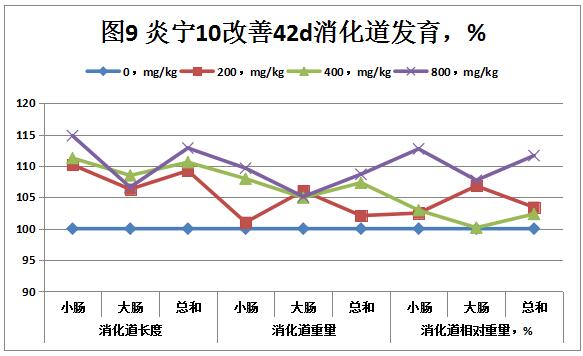
The effects of adding different levels of Yanning 10 on the development of the digestive tract in broiler chickens are shown in Tables 6, 7, 8, and 9. Compared with the control group, adding different levels of Yanning 10 to the diet had no linear relationship with the development of the digestive tract in broiler chickens after 21 days (P>0.05). However, adding Yanning 10 at 200 mg/kg, 400 mg/kg, and 800 mg/kg to the diet significantly increased the total weight of the small intestine and relative weight of the digestive tract in broiler chickens after 21 days (P<0.05). Adding Yanning 10 to the diet at doses of 200 mg/kg, 400 mg/kg, and 800 mg/kg significantly increased the length, weight, and total relative weight of the digestive tract in broiler chickens after 42 days (P<0.05). Adding different levels of Yanning 10 to the diet can linearly increase the small intestine length and total digestive tract length of broiler chickens for 42 days (P<0.05), and linearly and secondarily increase the small intestine weight, total digestive tract weight, and relative digestive tract weight (P<0.05).
3 Conclusion
Adding Yanning 10 to the diet at doses of 200 mg/kg, 400 mg/kg, and 800 mg/kg can significantly improve the production performance of broiler chickens, with 400 mg/kg being the most significant addition. The higher the level of addition, the lower the material to weight ratio.
3.2 There was no significant difference in the 21 day meat production performance of broiler chickens treated with different levels of Yanning 10; Increasing the concentration of Yanning 10 can improve the meat production performance of broiler chickens for 42 days.
There is no linear relationship between the increase of Yanning 10 addition level and the immune organ index of broiler chickens; Adding 10400 mg/kg of Yanning significantly increased the immune organ index of broiler chickens.
3.4 Increasing the level of Yanning 10 can promote the development of the digestive tract. Yanning 10 has the effect of promoting digestive tract development and promoting the growth of broiler chickens.
Table 1 Experimental Design
Handle | Yanning 10,mg/kg | Repetitions | Chicken count/Repetition | Total number of chickens |
1 | 0 | 12 | 20 | 240 |
2 | 200 | 12 | 20 | 240 |
3 | 400 | 12 | 20 | 240 |
4 | 800 | 12 | 20 | 240 |
Amount to | 960 |
Table 2 Experimental Diet Composition and Nutritional Level
Raw materials,% | 1-21d | 22-42d | Nutritional level,% | 1-21d | 22-42d |
Corn | 55.60 | 55.20 | ME,kcal/kg | 2890 | 3210 |
Expanded soybean meal/46% | 29.00 | 24.00 | CP | 21.50 | 19.50 |
Cottonseed meal | 2.50 | 3.00 | Calcium | 0.96 | 0.84 |
Wheat flour | 4.00 | 4.00 | Phosphorus | 0.66 | 0.55 |
Hydrolyzed feather powder | 1.50 | 1.50 | Lysine | 1.45 | 1.40 |
Calcium hydrogen phosphate/16.5% | 0.90 | 0.80 | Methionine | 0.54 | 0.50 |
Stone powder | 1.50 | 1.50 | Threonine | 0.91 | 0.80 |
Bentonite | 1.00 | 1.00 | |||
Soybean oil | 2.00 | 7.00 | |||
Premix | 2.00 | 2.00 | |||
Amount to | 100.00 | 100.00 |
Table 3: Effects of Different Addition Levels of Yanning 10 on the Production Performance of Commercial Broiler Chickens
Yanning 10,mg/kg | 1-21d | 22-42d | 1-42d | Weight, g/piece | ||||||||
Daily weight gain,g/d | Feed intake,g/d | F/G | Daily weight gain,g/d | Feed intake,g/d | F/G | Daily weight gain,g/d | Feed intake,g/d | F/G | 21d | 42d | ||
Comparative analysis of production performance | ||||||||||||
0 | 34.33 | 47.67 | 1.392 | 75.62 | 137.11 | 1.821 | 54.98 | 92.39 | 1.685 | 769.9 | 2358.0 | |
200 | 34.96 | 46.59 | 1.341 | 76.19 | 135.96 | 1.790 | 55.57 | 91.27 | 1.645 | 783.1 | 2383.0 | |
400 | 36.26 | 48.67 | 1.345 | 78.48 | 138.88 | 1.770 | 57.37 | 93.77 | 1.635 | 810.4 | 2425.2 | |
800 | 35.72 | 45.31 | 1.268 | 76.02 | 136.62 | 1.798 | 55.87 | 90.96 | 1.628 | 799.0 | 2395.4 | |
SEM | 0.400 | 0.348 | 0.016 | 0.794 | 0.636 | 0.016 | 0.485 | 0.419 | 0.011 | 8.401 | 19.957 | |
p-value | Significance | 0.228 | 0.023 | 0.013 | 0.034 | 0.365 | 0.056 | 0.014 | 0.101 | 0.010 | 0.023 | 0.046 |
Linear | 0.082 | 0.179 | 0.002 | 0.525 | 0.787 | 0.042 | 0.191 | 0.660 | 0.021 | 0.082 | 0.247 | |
Secondary | 0.156 | 0.158 | 0.009 | 0.379 | 0.871 | 0.372 | 0.162 | 0.586 | 0.046 | 0.156 | 0.336 | |
Comparative analysis of production performance,% | ||||||||||||
0 | 100 | 100 | 100 | 100 | 100 | 100 | 100 | 100 | 100 | 100 | 100 | |
200 | 101.8 | 97.7 | 96.3 | 100.7 | 99.2 | 98.3 | 101.1 | 98.8 | 97.6 | 101.7 | 101.1 | |
400 | 105.6 | 102.1 | 96.6 | 103.8 | 101.3 | 97.2 | 104.4 | 101.5 | 97.0 | 105.3 | 102.9 | |
800 | 104.0 | 95.0 | 91.1 | 100.5 | 99.6 | 98.7 | 101.6 | 98.5 | 96.6 | 103.8 | 101.6 | |
Table 4: The effects of different levels of Yanning 10 on the 21 day meat production performance and immune organ index of commercial broiler chickens
Yanning 10,mg/kg | Half bore rate | Eviscerating percentage | Pectoral muscle rate | Leg muscle rate | Thymus index | Fabry's capsule index | Spleen index | |
Meat production performance and organ index | ||||||||
0 | 79.32 | 64.75 | 22.83 | 19.98 | 0.51 | 0.46 | 0.16 | |
200 | 80.03 | 65.85 | 23.68 | 20.51 | 0.56 | 0.32 | 0.15 | |
400 | 80.15 | 65.35 | 23.25 | 20.60 | 0.56 | 0.30 | 0.17 | |
800 | 80.31 | 65.30 | 23.41 | 20.38 | 0.62 | 0.33 | 0.16 | |
SEM | 0.254 | 0.228 | 0.159 | 0.201 | 0.021 | 0.011 | 0.004 | |
p-value | Significance | 0.535 | 0.411 | 0.609 | 0.712 | 0.400 | <0.001 | 0.458 |
Linear | 0.173 | 0.569 | 0.370 | 0.474 | 0.104 | 0.001 | 0.435 | |
Secondary | 0.345 | 0.390 | 0.379 | 0.501 | 0.270 | <0.001 | 0.737 | |
Meat production performance and organ index,% | ||||||||
0 | 100 | 100 | 100 | 100 | 100 | 100 | 100 | |
200 | 100.9 | 101.7 | 103.7 | 102.7 | 109.3 | 68.3 | 94.6 | |
400 | 101.0 | 100.9 | 101.8 | 103.1 | 108.8 | 64.0 | 106.6 | |
800 | 101.2 | 100.9 | 102.5 | 102.0 | 119.8 | 72.1 | 102.2 | |
Table 5: Effects of different levels of Yanning 10 on 42 day meat production performance and immune organ index of commercial broiler chickens
Yanning 10,mg/kg | Half bore rate/% | Eviscerating percentage/% | Pectoral muscle rate/% | Leg muscle rate/% | Abdominal fat rate/% | Thymus index/% | Fabry's capsule index% | Spleen index/% | |
Meat production performance and organ index | |||||||||
0 | 88.83 | 78.34 | 26.00 | 20.29 | 0.98 | 0.30 | 0.05 | 0.08 | |
200 | 89.06 | 78.86 | 26.41 | 20.36 | 0.82 | 0.27 | 0.06 | 0.08 | |
400 | 89.39 | 79.06 | 26.85 | 20.68 | 0.82 | 0.37 | 0.07 | 0.09 | |
800 | 90.12 | 79.40 | 27.43 | 20.85 | 0.76 | 0.29 | 0.07 | 0.08 | |
SEM | 0.350 | 0.134 | 0.381 | 0.296 | 0.030 | 0.014 | 0.006 | 0.005 | |
p-value | Significance | 0.592 | 0.057 | 0.046 | 0.898 | 0.076 | 0.087 | 0.809 | 0.883 |
Linear | 0.179 | 0.006 | 0.162 | 0.448 | 0.017 | 0.532 | 0.357 | 0.886 | |
Secondary | 0.384 | 0.024 | 0.378 | 0.749 | 0.041 | 0.650 | 0.619 | 0.882 | |
Meat production performance and organ index,% | |||||||||
0 | 100 | 100 | 100 | 100 | 100 | 100 | 100 | 100 | |
200 | 100.3 | 100.7 | 101.6 | 100.3 | 83.7 | 89.0 | 114.4 | 98.3 | |
400 | 100.6 | 100.9 | 103.2 | 101.9 | 83.0 | 122.8 | 128.7 | 107.0 | |
800 | 101.5 | 101.3 | 105.5 | 102.8 | 77.8 | 98.0 | 128.2 | 94.8 | |
Table 6: Effects of Different Addition Levels of Yanning 10 on Digestive Tract Development in Commercial Broiler Chickens after 21 Days
Yanning 10,mg/kg | Digestive tract length | Digestive tract weight | Relative weight of digestive tract,% | |||||||
Small intestine | Large intestine | Sum | Small intestine | Large intestine | Sum | Small intestine | Large intestine | Sum | ||
Digestive tract development | ||||||||||
0 | 174.33 | 36.33 | 210.67 | 55.16 | 8.95 | 64.11 | 7.15 | 1.16 | 8.32 | |
200 | 174.83 | 36.50 | 211.33 | 55.55 | 9.35 | 64.90 | 7.30 | 1.23 | 8.53 | |
400 | 173.33 | 37.50 | 210.83 | 55.27 | 9.08 | 64.34 | 7.25 | 1.20 | 8.45 | |
800 | 174.33 | 37.00 | 211.33 | 59.81 | 9.27 | 69.08 | 7.87 | 1.22 | 9.09 | |
SEM | 1.983 | 0.708 | 2.564 | 1.114 | 0.316 | 1.290 | 0.134 | 0.041 | 0.156 | |
p-value | Significance | 0.995 | 0.089 | 0.997 | 0.025 | 0.082 | 0.233 | 0.024 | 0.080 | 0.025 |
Linear | 0.932 | 0.750 | 0.877 | 0.898 | 0.231 | 0.682 | 0.879 | 0.291 | 0.880 | |
Secondary | 0.994 | 0.893 | 0.977 | 0.126 | 0.324 | 0.129 | 0.119 | 0.409 | 0.138 | |
Relative value of digestive tract development,% | ||||||||||
0 | 100 | 100 | 100 | 100 | 100 | 100 | 100 | 100 | 100 | |
200 | 100.3 | 100.5 | 100.3 | 100.7 | 104.5 | 101.2 | 102.0 | 105.7 | 102.5 | |
400 | 99.4 | 103.2 | 100.1 | 100.2 | 101.4 | 100.4 | 101.4 | 102.9 | 101.6 | |
800 | 100.0 | 101.8 | 100.3 | 108.4 | 103.6 | 107.8 | 110.0 | 104.9 | 109.3 | |
Table 7: Effects of Different Addition Levels of Yanning 10 on Digestive Tract Development in Commercial Broiler Chickens at 42 Days
Yanning 10,mg/kg | Digestive tract length | Digestive tract weight | Relative weight of digestive tract,% | |||||||
Small intestine | Large intestine | Sum | Small intestine | Large intestine | Sum | Small intestine | Large intestine | Sum | ||
Digestive tract development | ||||||||||
0 | 168.67 | 53.00 | 221.67 | 88.43 | 23.93 | 112.36 | 4.20 | 1.14 | 5.34 | |
200 | 185.83 | 56.33 | 242.17 | 89.33 | 25.37 | 114.70 | 4.30 | 1.22 | 5.53 | |
400 | 187.67 | 57.50 | 245.17 | 95.48 | 25.11 | 120.59 | 4.32 | 1.15 | 5.47 | |
800 | 193.67 | 56.50 | 250.17 | 96.96 | 25.15 | 122.11 | 4.73 | 1.23 | 5.97 | |
SEM | 4.112 | 1.099 | 4.317 | 0.899 | 0.433 | 0.997 | 0.044 | 0.026 | 0.061 | |
p-value | Significance | 0.018 | 0.050 | 0.011 | 0.002 | 0.040 | 0.003 | 0.001 | 0.491 | 0.005 |
Linear | 0.040 | 0.236 | 0.025 | <0.001 | 0.378 | <0.001 | <0.001 | 0.427 | 0.002 | |
Secondary | 0.098 | 0.305 | 0.056 | 0.001 | 0.488 | 0.001 | <0.001 | 0.729 | 0.004 | |
Relative value of digestive tract development,% | ||||||||||
0 | 100 | 100 | 100 | 100 | 100 | 100 | 100 | 100 | 100 | |
200 | 110.2 | 106.3 | 109.2 | 101.0 | 106.0 | 102.1 | 102.5 | 106.8 | 103.4 | |
400 | 111.3 | 108.5 | 110.6 | 108.0 | 104.9 | 107.3 | 102.9 | 100.2 | 102.3 | |
800 | 114.8 | 106.6 | 112.9 | 109.6 | 105.1 | 108.7 | 112.7 | 107.7 | 111.6 | |